Mapping Race Digitally in the Classroom
Roya Biggie
[print edition page number: 489]
In the last two decades, the availability of GIS (geographical information technologies) has provided scholars across disciplines with new tools to pursue cultural geographical research. For literary scholars, particularly those interested in the relationship between literary texts and the material worlds they represent, mapping tools, such as Google maps, offer interactive interfaces that visualize “spatial patterns that remain hidden in texts and tables.”[1] Recent work includes the Stanford Literary Lab’s “The Emotions of London.” Led by Ryan Heuser, researchers at the lab have mapped eighteenth- and nineteenth-century novels’ affective representations of London, demonstrating in part how fictionalized and sociological accounts of the city diverge.[2] At Lancaster University, Ian Gregory and Christopher Donaldson have mapped a corpus of eighty texts (spanning from 1622 to 1900) on England’s Lake District. Their maps provide starting points for comparative analyses that attend to both representations of the region and the Lake District’s material terrain.[3] While scholars acknowledge the limitations of geospatial tools, noting that they are more equipped to convey precise data than ambiguity, such technologies provide new “ways of [generating] questions” rather than “binding interpretations.”[4] [490] As Barbara Piatta explains, “the best literary maps … [return] the reader to the text with new questions and ideas.”[5] Likewise, in the classroom, digital mapping projects grant students the opportunity to form innovative questions about literary and historical texts while developing visual interpretation and digital literacy skills.[6] Moreover, such projects also offer students an alternate medium through which to examine and represent histories of migration, exploration, and conquest.[7] In this chapter, I discuss a digital mapping project I assigned while teaching a course on race and cross-cultural exchanges in early modern English literature. Though I had no prior experience with digital mapping tools, I was interested in exploring how mapping technologies might yield new insights about the impact of European colonization and the exploitation of non-European land and people. In explaining the scaffolding of the assignment and reflecting on its challenges and pitfalls, my aim is to provide a project blueprint to other instructors of early modern literature, especially in courses devoted to the study of race in the European Renaissance.
Digital Mapping in the Humanities
The digital mapping assignments I have encountered demonstrate a common investment in students as researchers who can evaluate and manipulate technology and who can create and circulate new knowledge. In her recent book, New Digital Worlds: Postcolonial Digital Humanities in Theory, postcolonial and digital humanities scholar Roopika Risam argues that mapping projects, particularly in the postcolonial studies classroom, [491] help students to “see a new dimension of texts that span multiple locations, while increasing their understanding of the world, allowing them to learn not only how to use but also how to critique geospatial technologies and develop their critical thinking skills about geospatial data.”[8] In an effort to help students think about “the complexity of how race is negotiated in postcolonial texts … [and] the cultural contexts that shape blackness,” Risam has co-created the interactive database and digital map, A Cultural Atlas of Global Blackness, with her students. By clicking on the map’s various pins, viewers can read annotations on “postcolonial cultural texts … that engage with race.”[9] As Risam explains, students not only developed digital literary skills by assessing various GIS platforms, but also deepened their readings of postcolonial texts by gaining familiarity with their cultural and geographic contexts.[10] At the University of North Dakota, literary and digital humanities scholar David Haeselin has had students in his “American Migrations” course create a collaborative map of geographic locations in Junot Diaz’s The Brief Wondrous Life of Oscar Wao.[11] Some of these locations are central to the novel’s plot while others are passing references only mentioned once in the text. Using ZeeMaps, students annotated each location, discussing the location’s relevance to both specific characters and the novel’s overall plot. Haeselin aimed to show students how even brief details influence our reading of a [492] text, oftentimes even more so than those that are repeated. Haeselin was also interested in how “an interface that most of [his] students use regularly” could help students “more easily identify with [Diaz’s] characters, and perhaps, start to see them as peers.”[12]
Prior to teaching “Early Modern Transnational Encounters,” I was only vaguely familiar with the digital mapping work of other scholars and educators. My aim in this course was for students to analyze what Renaissance and postcolonial studies scholar Ania Loomba terms early modern “vocabularies of race,” language used to construct whiteness, emphasize ontological, religious, and cultural difference, and strengthen socio-economic systems that disproportionately granted power and influence to white Europeans.[13] As a class, we read early modern literary texts, including William Shakespeare’s Othello and The Tempest, John Fletcher’s The Island Princess, Edward Lord Herbert’s poetry, as well as contemporaneous travelogues, royal proclamations, and scientific treatises. We contextualized these literary and archival sources by turning to foundational scholarship on early modern race and colonization by critics such as Loomba, Kim F. Hall, Ian Smith, Bernadette Andrea, Ayanna Thompson, Jane Degenhardt, and Daniel Vitkus.[14] Because these literary, archival, and critical texts concerned cross-cultural exchanges, I was interested to see how the visual potential of a map might convey the consequences of racist, Eurocentric ideologies. Yet, I assigned the project without a clear [493] picture of a final product in mind. As a result, my instructions were at once vague and straightforward: Tell the story of your research to someone beyond our classroom through the medium of a digital map.
In designing the project, I was also eager to create more opportunities for collaboration and for students to think about publics beyond our classroom. As a teacher and scholar, I recognize the value of sharing research and written work; my own work is made better by the feedback I receive from generous colleagues, and my excitement for that work increases when I have the opportunity to talk through ideas and questions with willing listeners. I have noticed similar responses from my students. They are more enthusiastic about continuing their writing and research after discussing their thoughts in class and after a one-on-one or group conference, often refreshed by new questions, ideas, and lines of inquiry. I however felt that these opportunities to share their work and writing were not enough. They did not fully levy my students’ skillsets, and they did not help students develop or practice skills that they would likely need post-graduation. Put differently, in writing a traditional research paper, my students were writing and speaking to members of the class or those familiar and interested in a particular academic field. Though I was hesitant to forgo the more traditional elements of the research project, including a fifteen-page final essay, I believed that the addition of a public-facing digital project would help students develop writing and digital literacy skills that they could draw on later in their academic, personal, and professional lives.
About three quarters of the way through the semester, students began working on their research proposals, and as a class, we considered what it means to read, use, and create a map. Students read the introduction to Mark Monmonier’s seminal How to Lie with Maps, which conceptualizes maps as highly intentional cartographic representations that thus influence a viewer’s interpretation of data.[15] As Monmonier, a scholar of geography and cartography, reminds readers and as we all readily admitted, it is remarkably easy to forget — particularly with the advent of digital maps [494] and features like Google Street View — that “a single map is but one of an indefinitely large number of maps that might be produced for the same situation or from the same data.”[16] Seeking to cultivate “a healthy skepticism about maps,” Monmonier urges his audience to approach maps as they would any other authored, interpretive work.[17] Rather than turning to the contemporary maps and charts Monmonier cites, we analyzed sixteenth- and seventeenth-century regional and world maps, many of which depict human figures from Europe, Asia, Africa, and the Americas alongside the maps’ borders.[18] Drawing on recent work on cartography and embodiment by Renaissance studies scholar Valerie Traub, we discussed how the spatial medium of the map “inaugurated new ways to ‘know’ gendered, ethnic, racial religious, tribal, and national groups.”[19] In scrutinizing how spatial techniques contributed to conceptions of the foreign and familiar, students began to view maps as tools that — beyond assisting us to move through space — can produce and shape ethnographic and racialized knowledge.
To further expand my students’ thinking about what maps can do, I introduced the class to cartographic representations that most would not readily identify as maps. We examined, for example, Sensory Maps created by the artist Kate McLean.[20] McLean’s “New York’s Smelliest Blocks” represents the city’s gridded streets and provides viewers with a color-coded key of smells, olive green indicating “stagnant water,” pink “cheap [495] perfume.”[21] Multicolored brushstrokes of varying size adorn the map, conveying the intensity of the odor on a particular corner or street. In her tactile map of Edinburgh, Scotland, McLean uses collagraphy, a printmaking technique, to create different textures on paper that capture the affective and physical “feel” of the city’s various neighborhoods.[22] As students observed, McLean’s aesthetically seductive portfolio of smell, tactile, and taste maps — which orbit around questions of place, memory, and emotion — demonstrate the deeply subjective and visually experimental possibilities of cartography.
Students and I also examined maps that attempt to raise public consciousness by offering a visual form of political intervention. We discussed, for example, mortality maps of migrant deaths in the Sonoran Desert created by Humane Borders, a non-profit corporation in Tucson, Arizona, working in partnership with the Pima County Office of the Medical Examiner (OME). On their website, Humane Borders issues the following warning: “The information presented is stark and perhaps unsettling. However, both Humane Borders and the Pima County OME believe that the availability of this information will contribute to fulfilling our common vision.”[23] While they acknowledge that each organization has a unique mission, they explain that they are “committed to … raising awareness about migrant deaths and lessening the suffering of families by helping to provide closure through the identification of the deceased and the return of remains.”[24] The map is powered by Google GIS and looks initially familiar; however, viewers are confronted with densely dispersed and overlapping red pins; in fact, one must zoom in a few times to see [496] individual points.[25] Each pin contains a case report that includes, if known, the identity and age of the person, the date of the report, the exact location, the cause of death, and the county in which the body was found. In studying this map, students discussed how a familiar platform can represent data that is at once highly specific and visually impactful. As they observed, the barely distinguishable pinpoints underscore the severity of the crisis while each annotation reminds viewers of the individuality of the deceased. Through such conversations, students began to consider maps as more than navigational tools.
Before students began working on their maps, Grinnell’s Humanities and Digital Scholarship Librarian, Elizabeth Rodrigues, introduced students to two digital platforms: Omeka and Neatline.[26] Omeka is an open-source content management system that uses the Dublin Core Schema to include metadata for digital resources. Omeka’s plug-ins allow users to import resources from their collections onto other platforms, such as Neatline, a geotemporal exhibit builder. As the Omeka site explains, “Neatline adds a digital map-making environment that makes it easy to represent geospatial information as a collection of ‘records’ plotted on a map, which can be bound together into interactive exhibits that tell stories and make arguments.”[27] During a series of hands-on workshops, Dr. Rodrigues walked students through these platforms, showing students aspects of the site, including Neatline’s vector drawing tools. Once students had written their research papers, they used Omeka to curate [497] collections, incorporating critical and archival sources relevant to their research.
As students started to think about how they could visualize their analyses, we began, as a class, to revise the project’s initial prompt. Taking into account both time constraints and the limitations of the platforms, we decided that rather than attempt to represent the entirety of their claims, they would instead visualize a crucial aspect of their work that would benefit from the inclusion of a digital map. Thus, the maps, rather than offering another iteration of their research, served to supplement their essays, acting almost as visual guides to their papers. While I initially envisioned a project that could “stand alone,” thinking, with my students, about what they could feasibly do during the last few weeks of the semester led to a valuable discussion of the platforms as well as how the genre of a geotemporal map differs from that of a research paper.
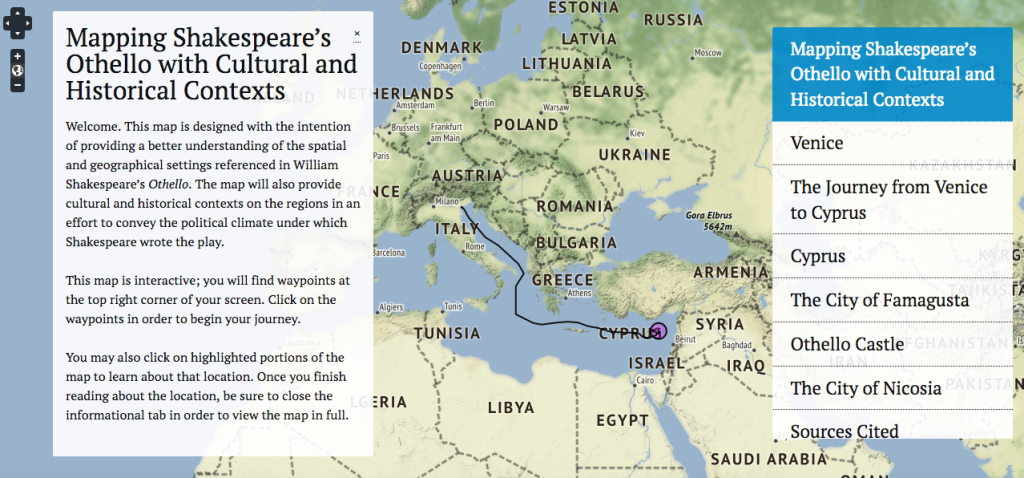
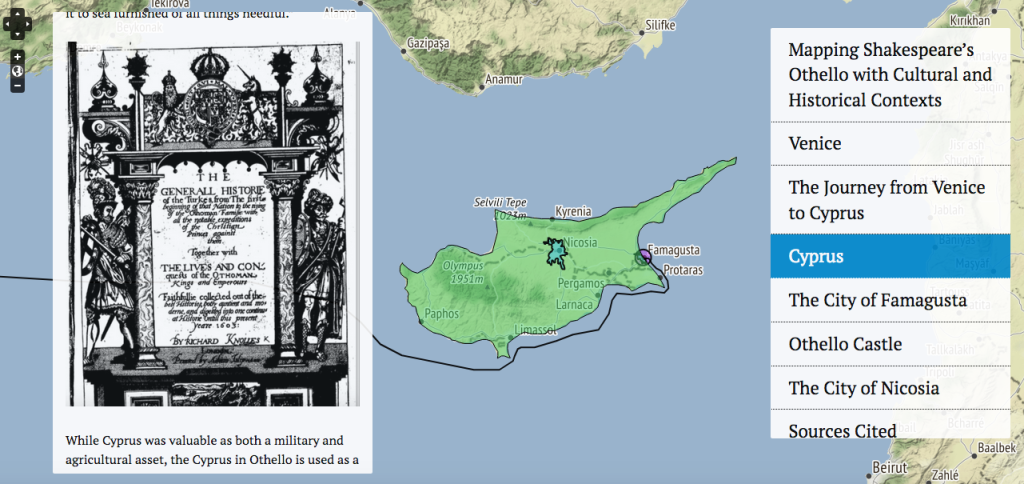
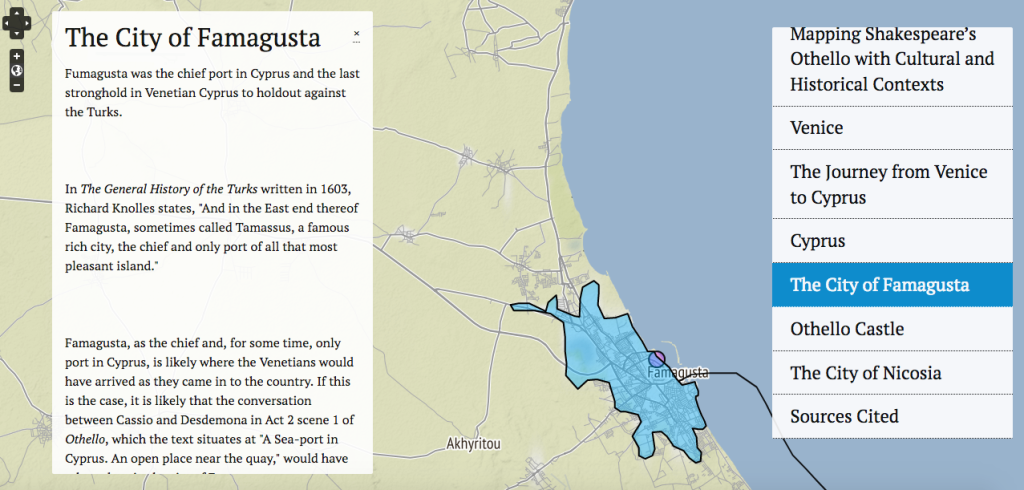
One student chose to represent the martial and political contestation over the island of Cyprus, mentioned though not staged in Othello (figure 1). Her map guide includes several waypoints that correspond with moments in the plot and various locations, some of which, though not referenced in the play, reflect her research on sixteenth- and seventeenth- century Cyprus. As she explains, she added these waypoints in an effort “to convey the political climate under which Shakespeare wrote the play.” By clicking on the map’s locations, located on the left, the map offers a [498] closer look at, for example, the city of Famagusta and the city of Nicosia. The student couples information about these various locations with readings of the play and non-literary sources, such as Richard Knolles’s The Generall History of the Turkes.
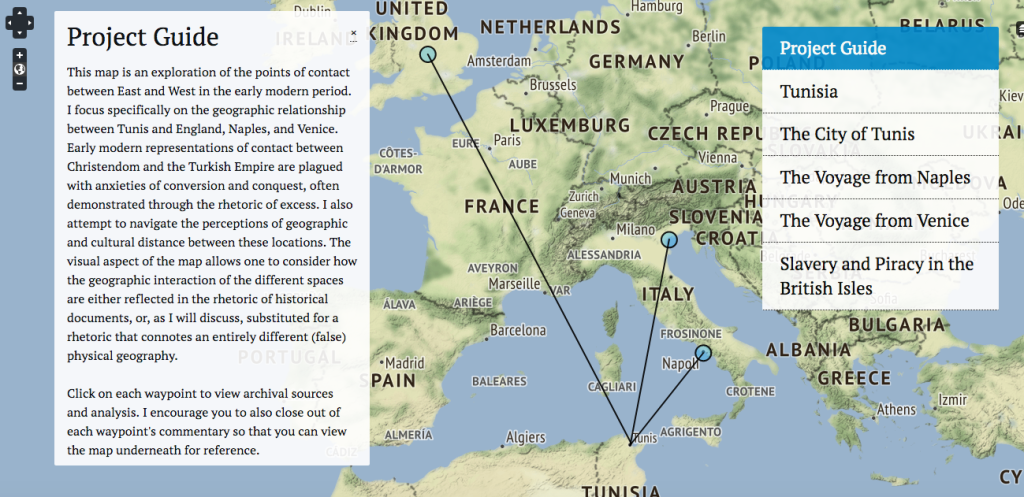
Another student chose to use the map to underscore the emphasis on physical and cultural distance in The Tempest. As she writes in her map guide, “The visual aspect of the map allows one to consider how the geographic interaction of the different spaces are either reflected in the rhetoric of historical documents, or, as I will discuss, substituted for a rhetoric that connotes an entirely different (false) physical geography” [499] (figure 4). The student used Neatline’s geometric tools to draw viewers’ attention to this thread of her argument.
As is evident from these maps, students were interested in demonstrating how a more precise understanding of the plays’ geographical contexts shape our interpretations and understanding of cross-cultural conflict, moments of tension, both alluded to and dramatized, between Venetians and Turks in Othello and between Neapolitans and Tunisians in The Tempest. The students include more nuanced analyses of these locales and characters’ journeys from one port city to another in their annotations of various waypoints. Although Europe and North Africa’s geography influenced students’ analyses — which was, in part, conveyed through the use of Neatline’s geometrical vector tools — they still relied heavily on text to communicate their claims.
During finals week, students presented their research papers and maps, explaining what they decided to represent and why they felt it necessary to visualize some but not other parts of their research. Although our audience was limited to the class itself, two students and I applied to and presented at the HASTAC (Humanities, Arts, Science, and Technology Alliance and Collaboratory) meeting, a professional, interdisciplinary conference. The conference offered these students another opportunity to think about the ways we communicate our research, both textually and visually, to audiences beyond the early modern literature — and even humanities — classroom. [500]
Overall, the project allowed students to develop an understanding of maps as mediums through which scholars can represent an argument and offer a particular perspective. Given students’ research topics and class discussions on early modern cross-cultural contact, students thought carefully about how spatial visualizations can foreground patterns and stories regarding colonization and human migration. They also began to consider how such visualizations can offer historical and literary analyses in a way not fully possible through writing alone. Though initially apprehensive about learning a new platform, students became more confident with these technologies as the semester progressed; I often reminded them that because they can now navigate Omeka and Neatline, they will find other new platforms less daunting. I also encouraged them to describe their work with Omeka and Neatline to potential employers. Although these specific platforms are not used in most industries, they demonstrate students’ digital literacy skills (i.e., if a student can master these platforms, they can presumably master others) as well as their capacity for self-directed learning.
Challenges and Recommendations
As is the case with most new assignments (digital or otherwise), ours faced several challenges. Due largely to time constraints, which included in-class workshops on Omeka and Neatline, peer-workshopping sessions, as well as additional course content, students struggled to familiarize themselves with the platforms while creating a digital map for the first time. Although conversations on maps such as those created by McLean and Humane Borders expanded students’ thinking about what a map can do and look like, fuller discussions on digital humanities maps (specifically, those built on Neatline) could have aided students early on in the process as they explored different ways of visualizing their research.[28] [501] Moreover, more explicit instructions and more transparent evaluative criteria could have helped students feel more at ease while both designing their maps and navigating unfamiliar digital platforms.
I conclude by offering several suggestions for instructors based on my initial piloting of this assignment:
- Involve students in the design of the project. As a class, discuss the advantages of illustrative maps versus those that draw the viewer back to the text and, as Franco Moretti puts it, “[bring] to light relations that would otherwise remain hidden.”[29] Such conversations may help students think through the advantages and limitations of the medium as they consider which research questions may benefit from spatial visualizations more so than others. Instructors might also lead students in developing a shared class “symbology.”[30] This common cartographic language will likely encourage students to experiment with and take advantage of the platform’s vector tools.
- Begin the project during the first few weeks of the semester. As I note above, having students discuss cartography, pursue research, and learn new digital platforms all while writing a research paper and creating a digital map is too much for the last several weeks of the term. Also consider cutting the research paper altogether and having students focus instead on their digital maps. While I believe the research proposal and annotated bibliography are still necessary components of the overall project, I am inclined to forgo the essay, in part because of time constraints, but also because assigning both a mapping project and a research paper risks positioning the map as secondary to what students may perceive as the traditional and therefore more important assignment. Moreover, having students [502] visualize their research after having written the research paper potentially forecloses some of the experimental possibilities of the digital map. While I was interested in seeing how my students’ research questions and textual analyses changed as they worked on their maps, I wonder if they were perhaps too committed to their initial work to entertain fully other interpretive possibilities.
- Introduce students to mapping projects and scholarship by those who work at the intersection of the humanities and digital cartography. As I have mentioned, familiarizing students with a range of mapping projects will help students conceptualize their own work and understand that they are contributing to a still emerging field. Texts I recommend include David J. Bodenhamer “The Potential of Spatial Humanities,” Roopika Risam’s “Postcolonial Digital Pedagogy,” and the collection, Literary Mapping in the Digital Age, edited by David Cooper, Christopher Donaldson, and Patricia Murrieta-Flores.[31] Instructors may also want to have students locate a digital map (created ideally by a literary scholar) and present that map to the class. In doing so, students will become acquainted with recent and foundational work in the field and can practice evaluating the successes and drawbacks of these projects.
Ultimately, I encourage instructors to view mapping assignments as works-in-progress, particularly given time constraints and the complexity of balancing course content and introducing students to new technologies. In part, it is because of these challenges that the project lends itself to student collaboration. I recall, still fondly and with excitement, some of our most enthralling class sessions in which students workshopped their visualizations. Students drew inspiration from one another’s maps and were quick to point out to their peers what exactly in their maps worked — what seemed both innovative and informative — as they reconsidered and reconceptualized their own work. They were excited to share not just their research, but their increasing knowledge of [503] the platforms, offering their classmates advice and specific “tricks,” different ways of utilizing the platforms’ features. Their collaborative generosity during these workshops — their willingness to work collectively through a specific issue even when that issue was particular to a single student — is ultimately one of the many things that made this project a success.
Discussion Questions
- How might digital mapping tools offer new possibilities for tracing the performance histories and literary legacies of sixteenth- and seventeenth-century drama? Why might a scholar, for example, utilize a geotemporal exhibit builder, such as Neatline, to record the proliferation of Shakespearean appropriations or “revisions”?[32] What patterns, questions, or new lines of inquiry might such maps yield?
- Most GIS technologies were not designed to represent textual analysis. What other tools, symbols, legends, and borders do humanities scholars and students need to convey the nuances of a text and complex, misrepresented, or undocumented histories? What might a new, more ideal map look like, and what might it be able to do?
- The development of cartography is inextricably linked to colonialism and the exploitation of indigenous populations, lands, and resources. In what ways can digital maps in the humanities classroom address and account for such legacies? How can these maps resist replicating imperialist codification and taxonomic impulses?
Suggestions for Further Reading
Aydelotte, Laura. “Mapping Women: Place Names and a Woman’s Place.” In Travel and Travail: Early Modern Women, English Drama, and the Wider World, edited by Patricia Akhimie and Bernadette Andrea. Lincoln, NE: University of Nebraska Press, 2019. [504]
Benjamin, Ruha. Race After Technology: Abolitionist Tools for the New Jim Crow. Cambridge, UK: Polity Press, 2019.
Bodenhamer, David J., John Corrigan, and Trevor M. Harris, eds. Deep Maps and Spatial Narratives. Bloomington, IN: Indiana University Press, 2015.
Davies, Surekha. Renaissance Ethnography and the Invention of the Human: New Worlds, Maps and Monsters. Cambridge, UK: Cambridge University Press, 2016.
Hess, Janet Berry, ed. Digital Mapping and Indigenous America. New York, NY: Routledge, 2021.
McKittrick, Katherine. Dear Science and Other Stories. Durham, NC: Duke University Press, 2021.
Pewu, Jamila Moore. “Digital Reconaissance: Re(Locating) Dark Spots on a Map.” In The Digital Black Atlantic, edited by Roopika Risam and Kelly Baker Josephs. Minneapolis, MN: University of Minnesota Press, 2021.
Ridge, Mia, Don Lafreniere, and Scott Nesbit. “Creating Deep Maps and Spatial Narratives Through Design.” International Journal of Humanities and Arts Computing: A Journal of Digital Humanities 7, no. 1/2 (2013): 176–89.
- David J. Bodenhamer, John Corrigan, and Trevor M. Harris, “Introduction,” in The Spatial Humanities: GIS and the Future of Humanities Scholarship, ed. David J. Bodenhamer, John Corrigan, and Trevor M. Harris (Bloomington, IN: Indiana University Press, 2010), vii. ↵
- Ryan Heuser, Mark Algee-Hewitt, Annalise Lockhart, Erik Steiner, and Van Tran, “Mapping the Emotions of London in Fiction, 1700–1900: A Crowdsourcing Experiment,” in Literary Mapping in the Digital Age, ed. David Cooper, Christopher Donaldson, and Patricia Murrieta-Flores (London, UK: Routledge, 2016); See also, Ryan Heuser, Franco Moretti, and Erik Steiner, “The Emotions of London,” Pamphlets, Stanford Literary Lab, accessed January 18, 2020, https://litlab.stanford.edu/LiteraryLabPamphlet13.pdf. ↵
- Ian Gregory and Christopher Donaldson, “Geographical Text Analysis: Digital Cartographies of Lake District Literature,” in Literary Mapping. ↵
- Barbara Piatti, “Mapping Fiction: The Theories, Tools and Potentials of Literary Cartography,” in Literary Mapping, 91. See also, Bodenhamer, “The Potential of the Geospatial Humanities,” in The Spatial Humanities, 23. ↵
- Piatti, “Mapping Fiction,” 100. ↵
- See Chris Johanson and Elaine Sullivan, “Teaching Digital Humanities through Digital Cultural Mapping,” in Digital Humanities Pedagogy: Practices, Principles and Politics, ed. Brett D. Hirsch (Cambridge, UK: Open Book Publishers, 2012), 123. ↵
- “Mapping,” Digital Pedagogy in the Humanities: Concepts, Models, and Experiments, MLA Commons, accessed October 1, 2019, https://digitalpedagogy.mla.hcommons.org/keywords/mapping/. ↵
- Roopika Risam, “Postcolonial Digital Pedagogy,” New Digital Worlds: Postcolonial Digital Humanities in Theory, Praxis, and Pedagogy (Evanston, IL: Northwestern University Press, 2018), 106. ↵
- Risam, “Postcolonial Digital Pedagogy,” 110. ↵
- More broadly speaking, Risam argues that digital projects are particularly useful in the postcolonial studies classroom because they help students understand the “omissions and inequalities” of the digital cultural record as directly tied to the “ongoing influences of colonial power” (90). Projects that trouble canonical formations or recover historically silenced voices help students “see themselves not simply as consumers of knowledge but as creators” (93). ↵
- David Haeselin, “Beyond the Borders of the Page: Mapping The Brief and Wondrous Life of Oscar Wao,” The Journal of Interactive Technology and Pedagogy 13 (June 2018): https://jitp.commons.gc.cuny.edu/beyond-the-borders-of-the-page-mapping-the-brief-wondrous-life-of-oscar-wao/. ↵
- Haeselin, “Beyond the Borders of the Page.” ↵
- Ania Loomba, Shakespeare, Race, and Colonialism (Oxford, UK: Oxford University Press, 2002). ↵
- Bernadette Andrea, “Black Skin, The Queen’s Masques: Africanist Ambivalence and Feminine Author(ity) in the Masques of Blackness and Beauty,” English Literary Renaissance 29, no. 2 (1999): 246–281; Jane Hwang Degenhardt, Islamic Conversion and Christian Resistance on the Early Modern Stage (Edinburgh, UK: Edinburgh University Press, 2010); Kim F. Hall, Things of Darkness: Economies of Race and Gender in Early Modern England (Ithaca, NY: Cornell University Press, 1995); Ian Smith, Race and Rhetoric in the Renaissance: Barbarian Errors (New York, NY: Palgrave, 2009); Ayanna Thompson, Performing Race and Torture on the Early Modern Stage (London, UK: Routledge, 2008); Daniel Vitkus, Turning Turk: English Theater and the Multicultural Mediterranean, 1570–1630 (New York, NY: Palgrave Macmillan, 2003). ↵
- Mark Monmonier, “Introduction” in How to Lie with Maps, 3rd ed. (Chicago, IL: University of Chicago Press, 2018). ↵
- Monmonier, “Introduction,” 2. ↵
- Monmonier, “Introduction,” 2. ↵
- We discussed, for example, Willem Janszoon Blaeu’s Nova Universi Terrarum Orbis Mappa (1605/24) and Asia (1617); John Speed’s “The Kingdom of Ireland” (1611/13); and Joannes Jansonnius’s Gallia Nova Galliae (1632). ↵
- Valerie Traub, “History in the Present Tense: Feminist Theories, Spatialized Epistemologies, and Early Modern Embodiment,” in Mapping Gendered Routes and Spaces in the Early Modern World, ed. Merry E. Wiesner-Hanks (Farmham, UK: Ashgate, 2015), 36. See also, Traub, “Mapping the Global Body,” Early Modern Visual Culture: Representation, Race, and Empire in Renaissance England, ed. Peter Erickson and Clark Hulse (Philadelphia, PA: University of Pennsylvania Press, 2000). ↵
- Kate McLean, “Sensory Maps,” accessed October 1, 2019, https://sensorymaps.com. ↵
- McLean, “New York’s Smelliest Blocks,” Sensory Maps, accessed October 1, 2019, https://sensorymaps.com/portfolio/nyc-thresholds-of-smell-greenwich-village/. ↵
- McLean, “Tactile Map: Edinburgh,” Sensory Maps, accessed October 1, 2019, https://sensorymaps.com/portfolio/tactile-map-edinburgh/. ↵
- “Arizona OpenGIS Initiative for Deceased Migrants,” Humane Borders, accessed October 1, 2019, http://humaneborders.info. ↵
- “Arizona OpenGIS Initiative for Deceased Migrants.” ↵
- “Custom Map of Migrant Mortality,” Arizona OpenGIS Initiative for Deceased Migrants, Humane Borders, accessed September 30, 2019, http://www.humaneborders.info/app/map.asp. ↵
- Dr. Rodrigues led two tutorials and held office hours during different phases of the project, providing students individual, personalized support. Had it not been for Dr. Rodrigues’s generosity of time and spirit, I would not have been able to teach a content heavy course and assign a digital project. I would also like to acknowledge that the project was enabled by the immense privilege of an institution with the resources to run a class of only five students. ↵
- Scholars’ Lab, “Neatline,” Omeka Classic, accessed October 1, 2019, https://omeka.org/classic/plugins/Neatline. ↵
- Although students created waypoints to illuminate their research on specific locations and used Neatline’s vector tools to signify various voyages, they relied heavily on text, demonstrating I think their hesitancy to allow their maps to represent visually their questions and analyses. ↵
- Franco Moretti, Atlas of the European Novel 1800–1900 (London, UK: Verso, 1997), 3. See also, Sally Bushell, “The Slipperiness of Literary Maps: Critical Cartography,” Cartographica 47, no. 3 (2012): 149–60. ↵
- See Piatti, “Mapping Fiction,” 93. Piatti describes creating a subject-specific symbology while working on A Literary Atlas of Europe with colleagues at ETH Zurich. Her team, for example, used different color scales “to distinguish between settings and projected spaces/places” (93). ↵
- Bodenhamer, “The Potential of the Geospatial Humanities”; Cooper, Donaldson, and Murrieta-Flores, Literary Mapping; Risam, “Postcolonial Digital Pedagogy.” ↵
- Peter Erickson, Citing Shakespeare: The Reinterpretation of Race in Contemporary Literature and Art (New York, NY: Palgrave MacMillan, 2007). ↵
